Live Logs
Live Logs is the real-time pulse of your account. Every click, postback, and pixel event streams in as it happens — making it the fastest way to confirm a campaign works and to debug one that doesn’t.
→ Open it: app.synaptyx.pro/logs
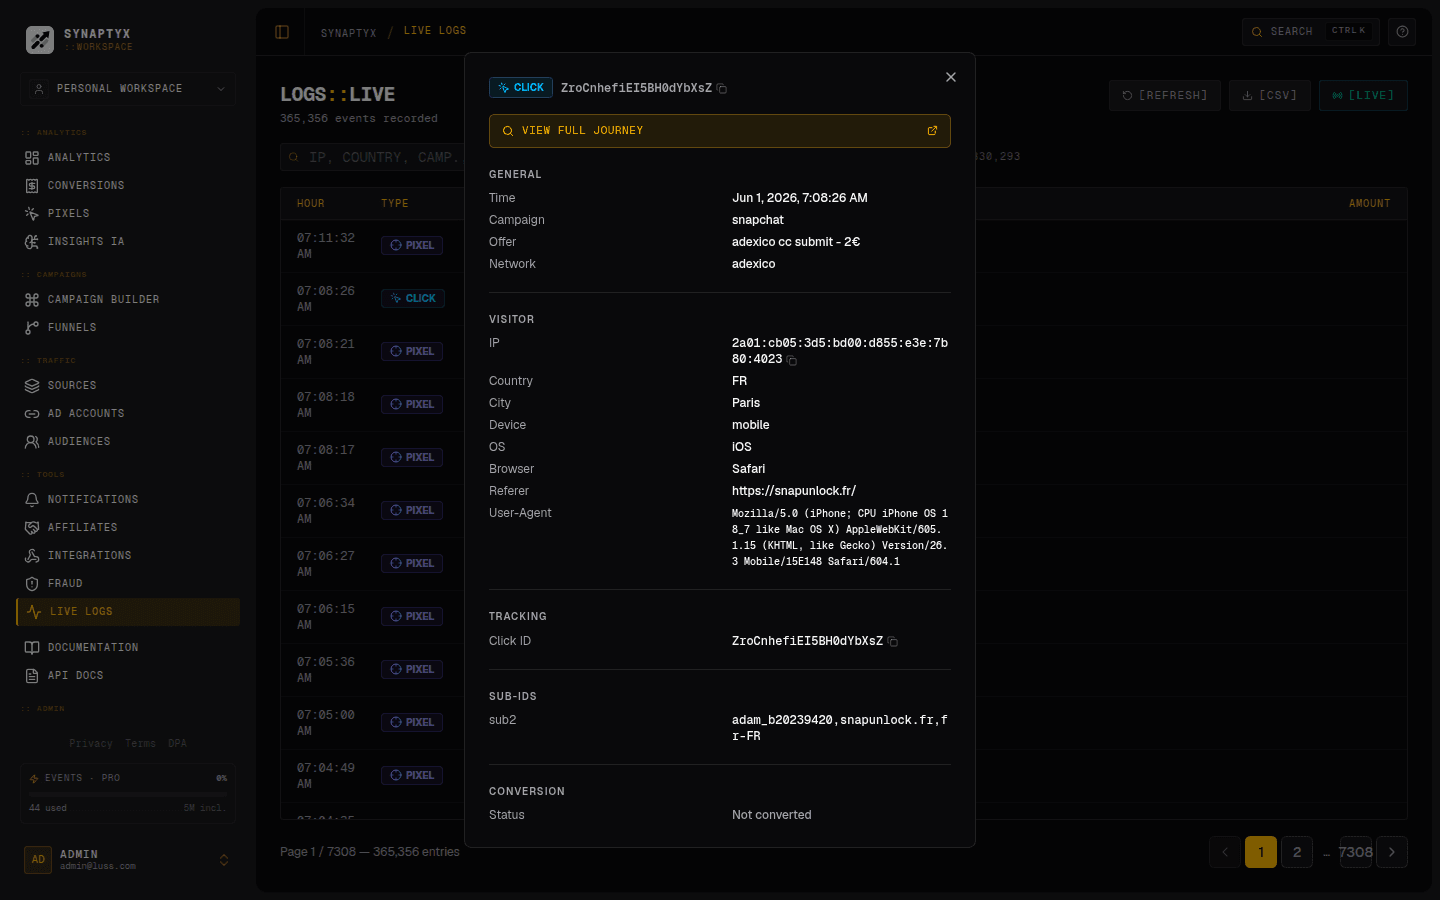
What you see
| Event type | Tells you |
|---|---|
| Click | A visit landed — with geo, device, browser, referrer, sub-IDs, and fraud score. |
| Postback | A conversion postback arrived (or failed, with the reason). |
| Pixel event | A page-side event fired (page view, add-to-cart, custom goal). |
What you can do
- Watch live as events arrive (server-sent stream), or browse history.
- Filter by event type, sub-ID, or IP address.
- Inspect any row to see the full request detail — headers, parsed device/geo, fraud flags, and the routing decision.
- Export CSV for offline analysis.
Why it’s the best debugging tool
When you launch a new campaign, open Live Logs and click your own /t/ link. Within a
second or two you’ll see the click appear — confirming it was recorded, which lander/
offer it routed to, and what fraud score it got. If something’s misconfigured (wrong
domain, bot-flagged, unexpected route), you’ll spot it instantly here.
A typical debugging loop:
Open Live Logs in one tab
Keep the feed running.
Hit your tracking link in another
Use different devices, browsers, or a VPN to test geo/device rules.
Confirm the routing
Expand the click row and verify the destination, country, device, and fraud score match what your flow should produce.