Analytics & Conversions
These are the pages where you read your data: aggregated analytics, the conversion list, and the real-time stream.
Analytics
→ Open it: app.synaptyx.pro
The reporting hub. Five tabs cover different angles:
| Tab | What it shows |
|---|---|
| Summary | Headline KPIs — clicks, conversions, revenue, spend, CR, EPC, ROI — over your selected period. |
| Explorer | Slice performance by dimension (country, device, landing page…) in sortable tables. |
| Creatives | Ad/creative-level breakdown so you can compare what’s working. |
| Benchmarks | Compare your CR/EPC/ROI against anonymized percentile bands (p25 / p50 / p75) of peers. |
| Leaderboard | Opt-in anonymized ranking against other users. |
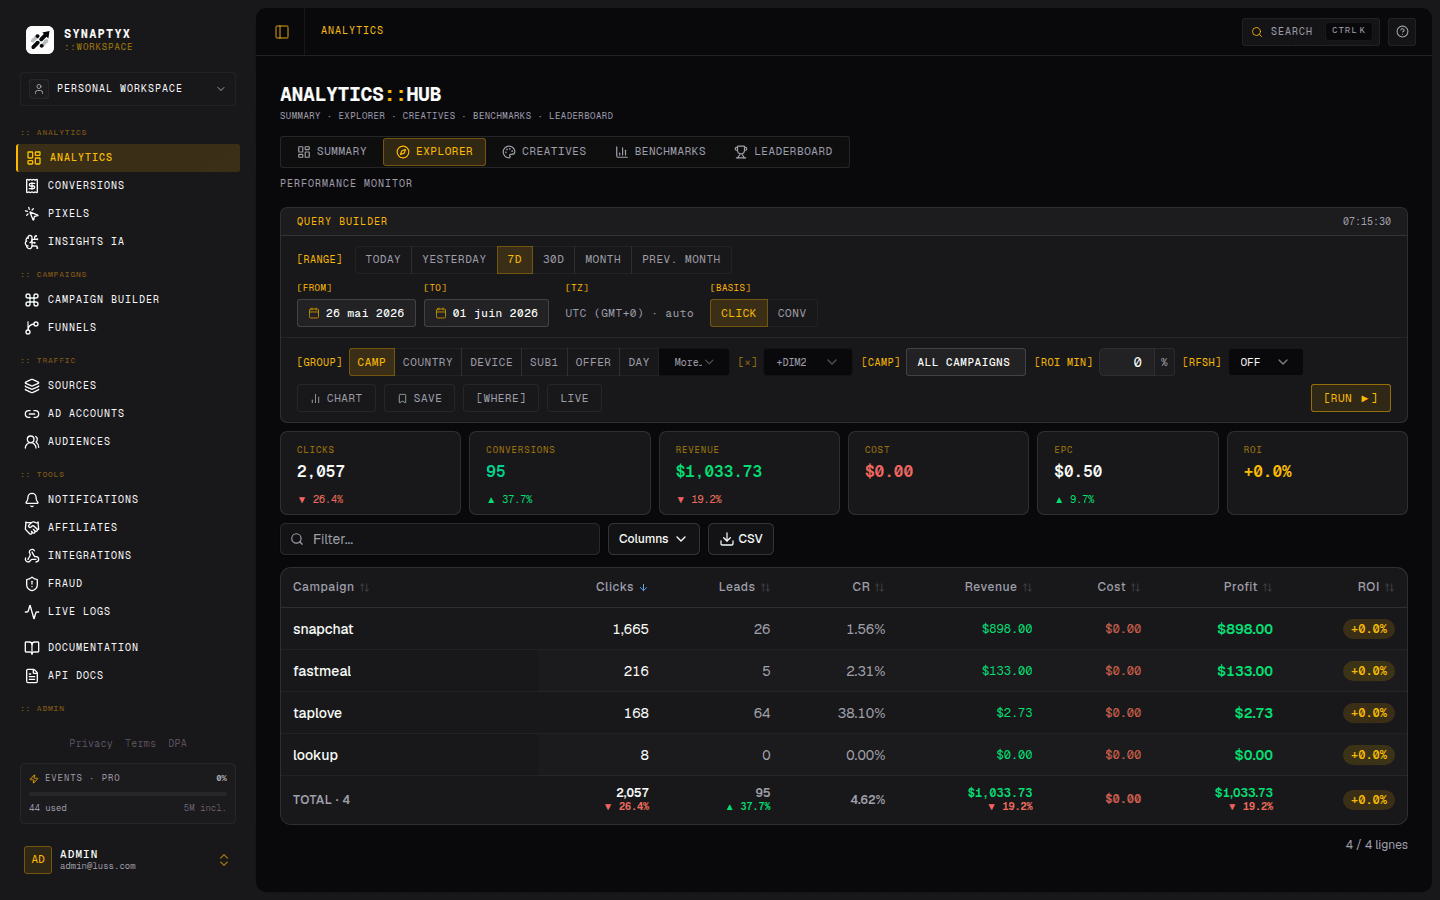
Common actions:
- Filter by date range and campaign.
- Break down by any dimension and sort.
- Export CSV for spreadsheets.
- Screenshot to PNG for quick sharing.
- Share a snapshot — generate a public, read-only link (
/share/<token>) with no sidebar, perfect for clients or partners.
All dates render in your timezone (set in Settings). The Benchmarks and Leaderboard data is anonymized — you see percentile bands and aliases, never another user’s identity.
Conversions
→ Open it: app.synaptyx.pro/conversions
A searchable, paginated list of every conversion — revenue, status, event, and campaign — defaulting to the last 30 days.
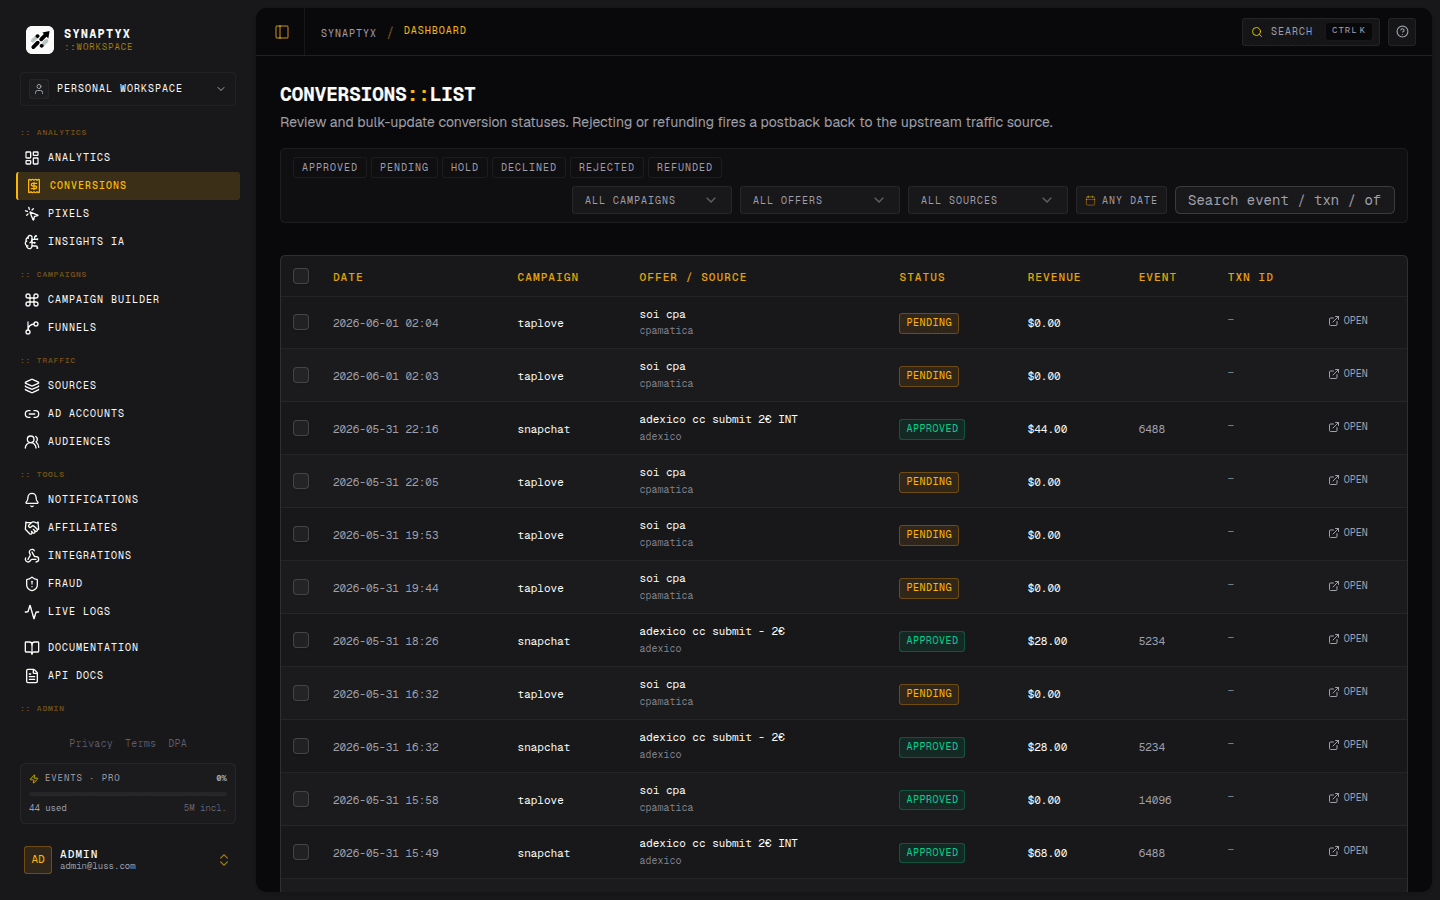
- Filter by status and date; search by transaction or click ID.
- Click any row to open its journey (
/conversions/<clickId>): the full lifecycle of that click → conversion, including the captured request data.
The journey view is the canonical place to answer “what exactly happened with this
sale?” — and the command palette (⌘/Ctrl + K) can jump straight to it by click or
transaction ID.
Live Logs
For the real-time, server-sent stream of clicks, postbacks, and pixel events — with a full request inspector — see the dedicated Live Logs page. It’s the fastest way to debug a new campaign.